
This driver will allow you to record, and later visualize, all sorts of data on a Control4 system.
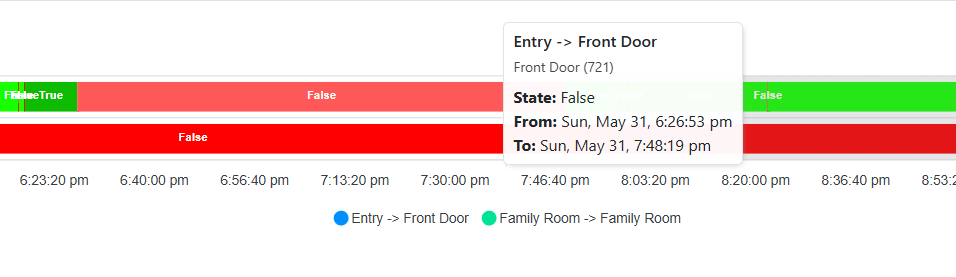
You can record light levels, contact or relay states, or any other variable that exists in the project.
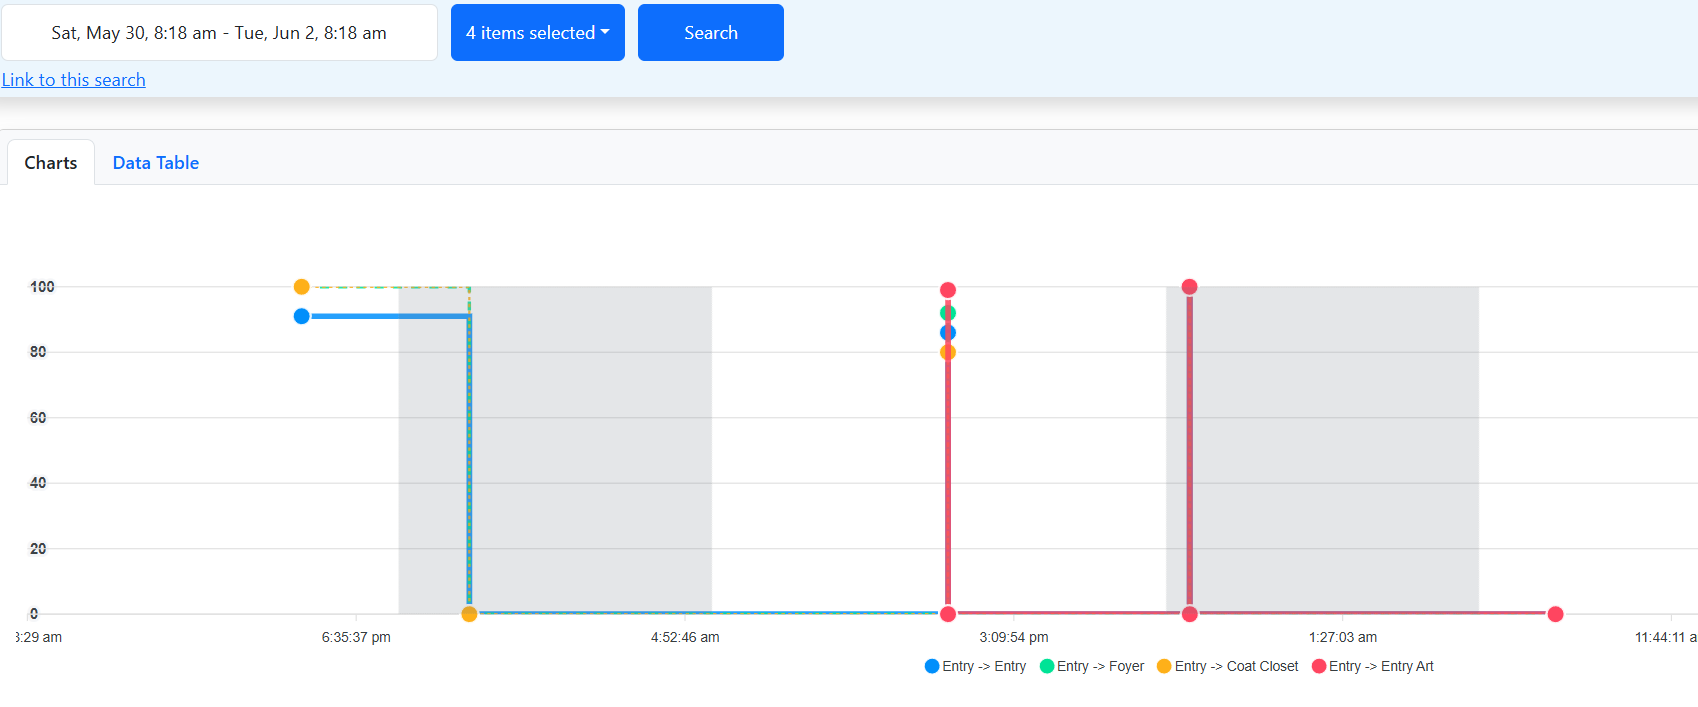
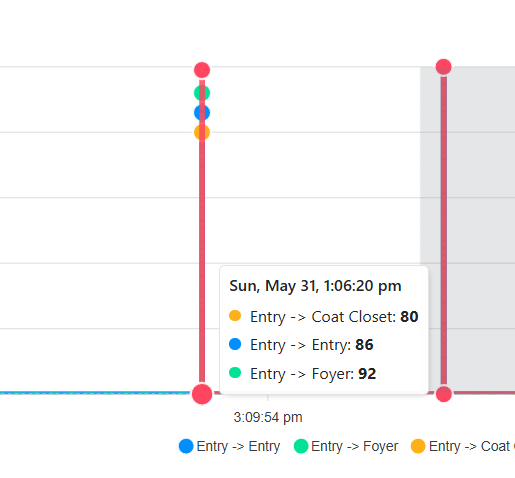
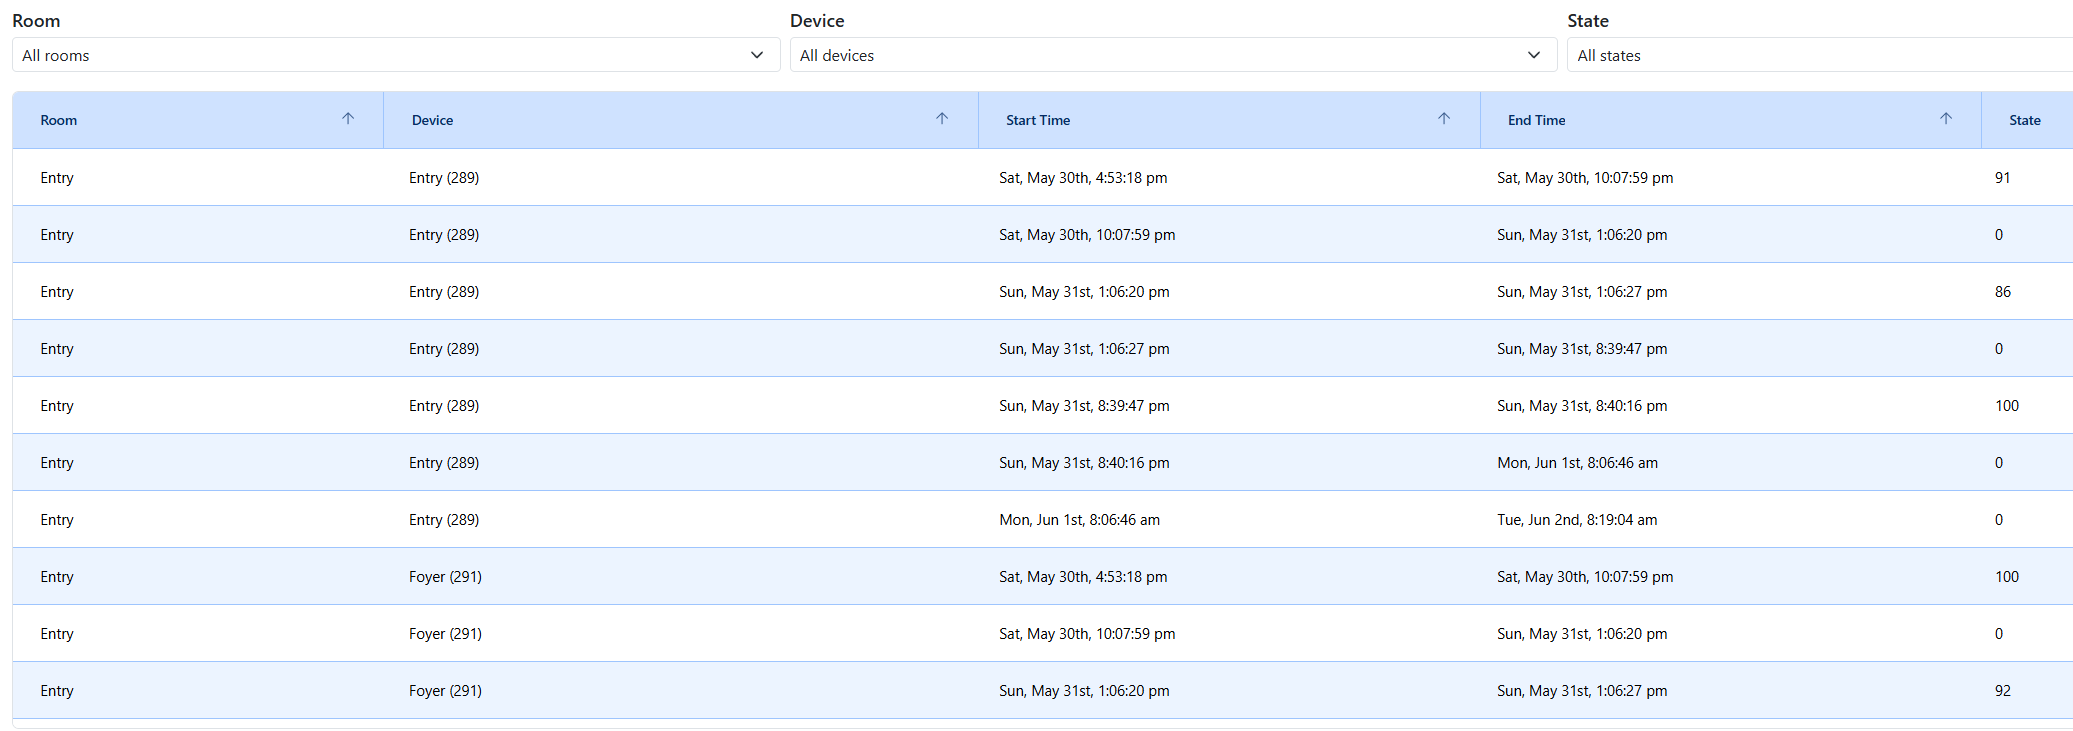
Recorded data can then be visualized via a web interface.
The Web Interface will allow you to select a timeframe and which devices you want to view, it will then generate graphs will all the requested data.
Great for troubleshooting complex scenes or automation, system monitoring, or pass it on to the client so they can get a better idea of what's going on in the home.
FAQs:
- Q: What can I monitor?
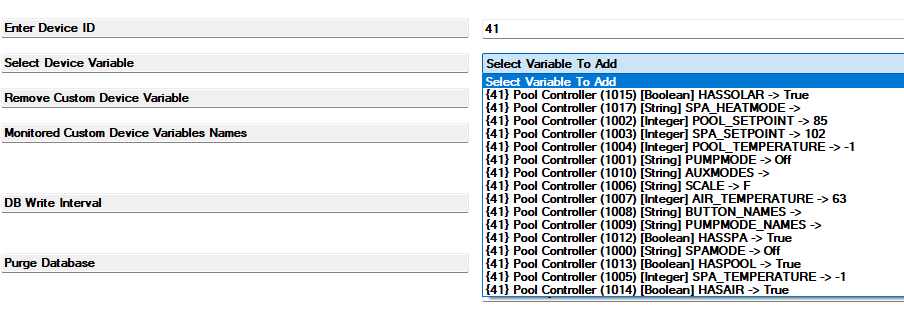
A: Light levels, contact and relay states, user variables (set in the Variables Agent), or any device variable! - Q: How can I access the web interface?
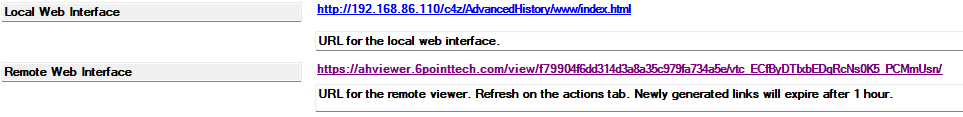
A: The web interface lives on the Controller, and can be accessed at any time via the Controllers IP Address. Additionally, a link for remote viewing can be generated via Composer, which will make the interface available on a 3rd party server so it can be accessed from anywhere.
For security and privacy reasons, this link will expire after 1 hour. A new link can be generated at any time. - Q: Will this slow down the system?
A: The driver has little to no impact on system perfomance.
Performace may be slightly impacted for a short amount of time (usually less than a second) while the driver is writing information to the database. This only happens every few minutes (configurable in Properties) - Q: Can users view the interface via the Control4 App or touchscreens?
A: Due to it's complexity, the web interface is designed to be viewed in a browser
Quick Guide:
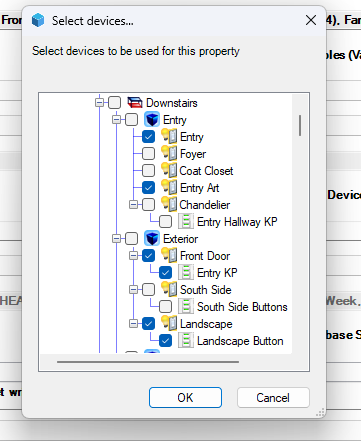
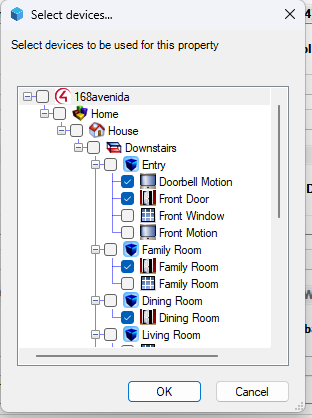
- Choose Lights, Contacts/Relays, or Variables (From Variables Agent or device Variables):

- Retreive the link for local or remote viewing
- View your Data!


6/2/2026 - 100004:
- Initial Release